Climate change, renewable energy, and Gulf Cooperation Council stock market dynamics: A quantile vector autoregression and wavelet quantile framework

Climate change, renewable energy, and Gulf Cooperation Council stock market dynamics: A quantile vector autoregression and wavelet quantile framework

Climate change, renewable energy, and Gulf Cooperation Council stock market dynamics: A quantile vector autoregression and wavelet quantile framework

31 views
Categories: Articles
Authors: Alanoud Al-Maadid, Mohamed Sami Ben Ali, Ijaz Younis
College of Business & Economics, Qatar University, Doha, Qatar
Received 5 May 2025, Revised 13 July 2025, Accepted 19 July 2025, Available online 25 July 2025, Version of Record 25 July 2025.

Abstract

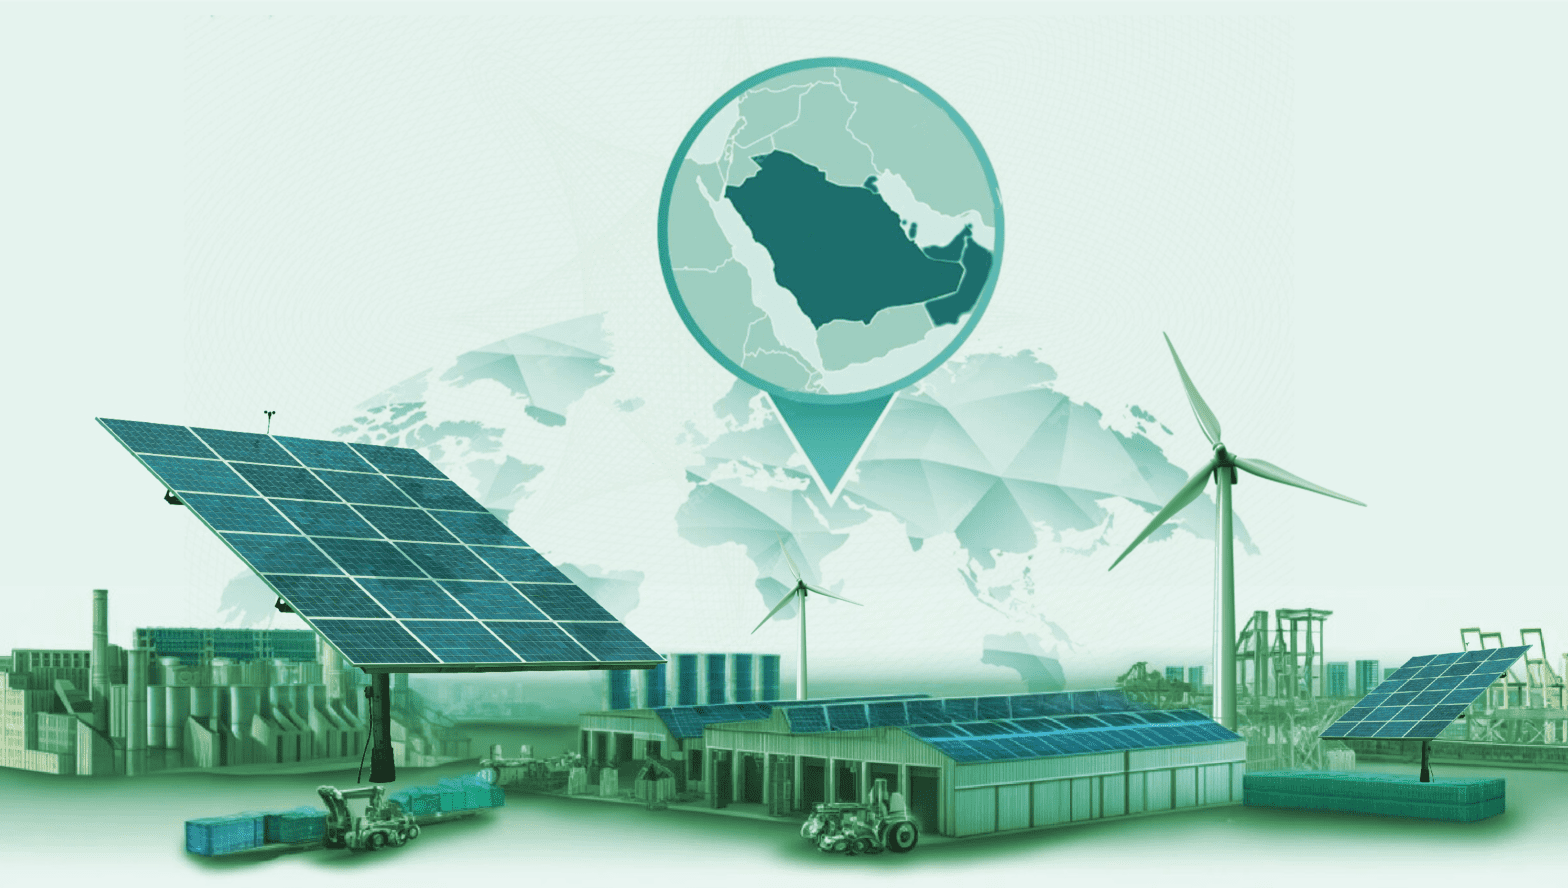
The Gulf Cooperation Council region's heavy reliance on oil revenue presents unique challenges and opportunities in transitioning to a sustainable economic model. This study employs quantile vector autoregression and wavelet quantile correlation techniques to explore the intricate relationships between climate change, renewable energy, and market returns in the region from August 29, 2014, to December 2023. Our findings reveal that Saudi Arabia, the United Arab Emirates, and Kuwait, serve as net influencers across various economic conditions, emphasizing their critical role in shaping regional dynamics. These economies exhibit resilience during extremely negative conditions, with positive net values indicating their capacity to absorb shocks. In contrast, smaller economies, such as Oman and Bahrain, demonstrate increased vulnerability. Interestingly, the renewable energy index exhibits a slight stabilizing effect during downturns, whereas temperature fluctuations have a significant impact on economic performance, indicating a broader environmental influence on it. The total Connectedness Index consistently remains high across quantiles, underscoring the rapid transmission of economic shocks and benefits within the region. These results highlight the interconnectedness of these economies, revealing that both risks and advantages are swiftly disseminated throughout the region, particularly during times of crisis or exceptional growth. This study provides policymakers, investors, and stakeholders in the region with valuable insights, contributing to a deeper understanding of how climate change and renewable energy initiatives are influencing financial markets.

1. Introduction

As the global discourse on climate change continues to evolve, examining the specific challenges faced by economies highly dependent on fossil fuels, particularly those of the Gulf Cooperation Council countries (GCC) is crucial. The global discourse on climate change has intensified in recent decades, significantly affecting various sectors, particularly financial markets, and has been explored in recent studies (Bouri et al., 2022Su et al., 2020Lorente et al., 2023). Climate change, driven by rising greenhouse gas emissions and environmental degradation, has triggered a global shift towards renewable energy sources, posing both challenges and opportunities for economies. With increased awareness of ecological issues such as global warming, discussions about the planet's climate have proliferated (Abbasi et al., 2022). Due to the continued rise in temperature caused by climate change, the global economy is projected to experience a 10 % increase in costs by 2050. Renewable energy sources offer hope for mitigating global warming and climate change, as well as investor panic, by providing less risky or risk-free stock options. Thus, it is essential to understand the significant potential advantages of diversifying investments across various assets in the event of exogenous negative shocks.
The transition to renewable energy sources is especially pressing for the Gulf Cooperation Council region, given its significant role in global oil production and the environmental challenges it faces. However, among economies, the GCC countries, which are predominantly oil-exporting economies, face a unique transition challenge, especially during a shock (Abuzayed and Al-Fayoumi, 2021Cheikh et al., 2022Umar et al., 2021). While their economies have traditionally relied on fossil fuels, recent global environmental concerns and energy market volatility have compelled these economies to adopt renewable energy solutions. As diversification provides investors with greater protection from the negative effects of shocks, it can reduce risk, especially in markets that are susceptible to global shocks. Numerous studies have shown that with climate change, the volume of information that moves between different stock markets (Younis et al., 2024Barberà-Mariné et al., 2023).
Amid these challenges, the GCC has begun investing in technology-driven solutions to mitigate climate impacts, which in turn influence stock markets and economic policies. According to British (Fanchi and Christiansen, 2016), GCC economies have an abundance of carbon resources, accounting for 20 % of the world's confirmed natural gas reserves and 40 % of the world's proven oil reserves. The Gulf region experiences two distinct seasons: winter (November–March) and summer (April–September). Summer temperatures with low humidity can reach 50°C, whereas winter temperatures can drop as low as 15°C and rise as high as 26°C. Sand and dust storms are common in this area, and population growth has increased energy consumption. Qatar has the highest emissions (Al-Maamary et al., 2017). Due to the enormous energy demand in the GCC, hydrocarbons are used inefficiently, which is detrimental to both the environment and human health. As greenhouse gas concentrations have increased to 400 parts per million, concerns regarding global climate change have intensified (Shapland, 2023). This study is crucial for understanding the impact of climate change and the shift to renewable energy on GCC financial markets, enabling policymakers to ensure economic resilience and market stability in the face of climate-related risks.
This drive toward renewable energy is part of a broader global transformation that also affects the region’s financial systems and stock markets. The GCC economies have developed a technological infrastructure designed to promote sustainable development and environmental preservation through the use of clean and renewable energy (Abdmouleh et al., 2015). Countries have signed international agreements, such as the Kyoto protocol, which require them to meet greenhouse gas emission reduction goals. eenewable energy sources account for 15–20 % of the world's energy needs and are abundant, clean, and limitless. Examples of renewable energy sources include solar, wind, and hydropower (Bhutto et al., 2014). The cost difference between renewable energy sources and conventional sources will narrow as renewable energy sources technology advances, making renewable energy sources more affordable than conventional energy sources. To capture and store carbon dioxide, the United Arab Emirates is deploying carbon capture and storage technologies in several industrial sectors, including the steel industry. With the use of this technology, fossil fuels can be used indefinitely with lower emissions (Ustadi et al., 2017). By utilizing data analytics and sophisticated grid management technologies, the energy usage of power grids can be optimized to increase efficiency and lower emissions (Panda and Das, 2021). This study addresses the critical need to understand the impact of climate-related factors and renewable energy policies on stock markets in GCC economies, which are heavily reliant on fossil fuels.
The energy transition entails a significant transformation of global energy systems, moving from traditional fossil fuels to greater reliance on renewable energy sources. This process is crucial for addressing contemporary challenges, including climate change, energy security, socioeconomic inequalities (Cao, 2024Mohammed et al., 2023), and financial risk (Zhang et al., 2024Mao et al., 2023). The transition involves intricate dynamics across multiple realms, including environmental, economic, social, and technological factors, which must be holistically addressed to create a sustainable energy future in the region. Analyzing the connections between renewable energy, climate change, and the economies of the GCC is crucial for promoting resilience and sustainability. This study examines the quantile-tail interconnectedness between climate change, renewable energy investments, and GCC stock markets using the quantile vector autoregressive approach, a novel technique that provides a more comprehensive understanding of market behavior under various conditions.
Climate variables, and in particular temperature, can affect financial markets through several theoretical channels. On the other hand, higher temperatures may have implications for investor sentiment (especially in regions such as the GCC, where persistent heat can impact daily economic production), which could raise uncertainty and increase risk aversion when making financial decisions. Second, sectoral sensitivity matters; sectors that are more sensitive, such as construction, tourism, and energy, which are dominant in the GCC, are directly affected by climate variability, which has an impact on company earnings and, therefore, on stock prices. Third, climate change can alter macroeconomic expectations regarding long-term sustainability, future regulation, and the cost of adaptation, all of which are reflected in stock market prices. Such mechanisms are amplified in oil-reliant nations, where temperature-driven energy demand and emission issues play a direct role in policy, resource allocation, and investment contexts. Therefore, to better comprehend how stock markets respond to temperature fluctuations, it is necessary to move beyond a single level and integrate the environmental, human, and financial transmission mechanisms simultaneously.
This study is motivated by the urgent policy need to understand how environmental stressors and the transition to clean energy reshape financial market stability in oil-dependent economies. The GCC region faces a dual challenge: sustaining macroeconomic growth under rising climate risks while transitioning away from fossil fuels in alignment with international climate goals. Traditional macro-financial models fail to capture the non-linear and asymmetric nature of shock transmission during climate-related stress, leaving a gap in tools available to policymakers and regulators. This paper addresses a pressing policy-level problem: how to quantify and manage climate-related financial risks and green investment uncertainty under varying market conditions. The lack of quantile-based systemic risk tools tailored to resource-rich economies leaves GCC governments exposed to underestimating climate-induced spillovers and volatility. As climate change intensifies, transitioning to renewable energy sources is essential. Recent research highlights the co-movement and interconnection between GCC financial markets and global energy prices, particularly during turbulent periods (Alnafisah et al., 2024). This interconnection is further emphasized in the context of geopolitical events, such as the Russia-Ukraine war, which shows the dynamic relationships between clean energy, crude oil prices, and equity markets (Chkili and Mabrouk, 2024). With the increase in investments in renewable energy, technological innovation plays a fundamental role in modeling banking markets in the GCC (Younis et al., 2024). In addition, the link between oil prices and the performance of the share market suggests the need for advanced quantitative analyses, particularly the use of frequency domain causality with rotating groups (Sezen et al., 2025). This suggests that political implications should focus on enhancing renewable energy investments to mitigate climate-related risks while also considering research gaps in these dynamic interconnections (Naeem et al., 2024). The results provide a path for developing comprehensive plans that address the dual challenges of climate change and economic stability in the GCC (Aloui et al., 2024).
Addressing the challenges outlined, this study enriches the current literature by offering meaningful improvements and insights into the topic. First, While several studies have explored climate-financial linkages, most focus on advanced or diversified economies. This paper contributes to the literature by applying advanced quantile-based techniques (quantile vector autoregression and wavelet correlation) to investigate how climate variables and renewable energy shocks asymmetrically impact financial systems in a region where fossil dependency and climate vulnerability are uniquely intertwined. The contribution lies not in the context itself, but in the methodological advancement and policy insight derived from tail risk modeling under extreme market scenarios. It fills a crucial gap by focusing on the GCC, a region central to the global energy transition that remains heavily reliant on fossil fuels. Recent studies have focused on the relationships between renewable energy, carbon dioxide emissions, and the growth of oil-producing countries (Abban et al., 2022Alkathery and Chaudhuri, 2021Shpak et al., 2022). This study addresses the policy-level issue of how financial and economic networks pose challenges for GCC markets, influenced by regional energy prices and the transition to alternative energy sources. Second, this study distinguishes itself from prior research by integrating GCC equity markets with climate change (heat temperature) and renewable energy markets, offering fresh insights into their complex quantile tail connectedness and implications for stakeholders. Climate with economic growth and clean energy bonds in the context of the GCC has been observed (AbouElseoud and Alkhaldi, 2023Cochrane and Al-Hababi, 2023Naeem et al., 2023), but this study is different in the context of (temperature). Third, this study uses an innovative quantile vector autoregression model to capture the nonlinear interconnectedness between climate change, renewable energy, and GCC stock markets, revealing insights across varying market conditions. Some recent studies have examined renewable energy and stock connectedness using time-varying parameter vector autoregression (Ali et al., 2023Bouteska et al., 2024), as well as climate uncertainty and stocks (Ali et al., 2023Bouteska et al., 2024Liu et al., 2025Zhou et al., 2023). Additionally, energy and GCC stock market links have been explored during the crisis (Younis et al., 2025Kapar et al., 2024). However, this study differs in that it utilizes quantile vector autoregression with wavelet analysis.
Our findings indicate that Saudi Arabia, the United Arab Emirates, and Kuwait are key influencers of regional dynamics, demonstrating resilience in adverse conditions and absorbing shocks. In contrast, smaller economies, such as Oman and Bahrain, are more vulnerable. The renewable energy index (ECOI) has a slight stabilizing effect, whereas temperature fluctuations have a notable impact on economic performance. The total connectedness index (TCI) remains high, highlighting the swift transmission of economic shocks and benefits within the GCC countries. Our findings provide valuable insights for informing regulatory policies, investment strategies, and financial market reforms in response to climate-related risks.
The remaining section of the paper is structured as follows: 2 reviews the relevant literature, 3 outlines the research methodology, 4 discusses the empirical findings, and 5 concludes with key insights and policy implications.

2. Literature overview

Statistical data reveal a strong correlation between an increase in greenhouse gas emissions and rising global temperatures, often associated with climate change. The increasing levels of greenhouse gases, primarily caused by human activities such as burning fossil fuels and deforestation, present serious climate-related issues (Raihan et al., 2023). Fossil fuel extraction is a significant contributor to climate change, accounting for 82 % of global energy in 2021, down from 83 % in 2019. Climate change threatens tourism, agriculture, biodiversity, and the public health. Other studies have also pointed out that global agribusiness, biodiversity, and tourism are all at risk due to rising temperatures (Lorente et al., 2023Robbins Schug et al., 2023). Additionally, climate change leads to illnesses, drug resistance, and food shortages (Abbass et al., 2022). While climate change and greenhouse gas emissions are escalating global challenges, innovations in renewable energy are emerging as a critical solution for mitigating these environmental impacts.
Global studies have increasingly focused on how technological innovations in energy can help achieve climate targets and reduce emissions. Authorities worldwide have acknowledged the importance of innovation in achieving climate targets, particularly in reducing greenhouse gas emissions, such as carbon dioxide (Raihan et al., 2023Guo et al., 2017Pata et al., 2023Imaz and Sheinbaum, 2017). A study by Alola and Onifade (2022) on the Finnish economy demonstrated that innovation in energy sources can have a positive impact on the environment. Renewable energy, such as solar power, is being promoted to reduce carbon emissions, enhance energy security, combat global warming, and support sustainable economic growth (Lee and Ho, 2022). In a similar setting, Raihan and Tuspekova (2022) underline the importance of renewable energy sources in helping economies reach their target of a 50 % global emissions reduction by 2050. Furthermore, a recent study found that the role of risk spillovers between renewable energy and fintech in European real estate markets changed during the COVID-19 pandemic and the Russia-Ukraine conflict (Shah et al., 2025). In light of these innovations, many emerging economies, including those in the Gulf Cooperation Council (GCC), face the dual challenge of addressing climate change while ensuring sustainable economic growth.
Renewable energy adoption and technological advances are essential tools for overcoming these challenges and achieving the Sustainable Development Goals. Achieving the 17 Sustainable Development Goals, which aim for social, economic, and environmental progress, is especially challenging for emerging economies such as those in the Gulf Cooperation Council (GCC) (Ben Ali and Lechman, 2024). Consequently, numerous studies have examined how the adoption of renewable energy, technological advancements, and economic growth can address climate change challenges and promote sustainable development (Imaz and Sheinbaum, 2017Liu et al., 2022). A recent study found weaker market interconnectedness during the oil battles and the Russia–Ukraine war but stronger links during the COVID-19 pandemic. The United Arab Emirates (UAE), Saudi Arabia, and WTI were key risk transmitters, while Oman, Kuwait, gold, and Qatar were major spillover receivers (Younis et al., 2025). While renewable energy adoption is gaining attention in the GCC, the role of stock markets in responding to external shocks, such as climate change, remains critical.
Market interconnections, particularly during crises such as the COVID-19 pandemic and geopolitical tensions, play a crucial role in shaping investors’ responses to these changes. Modern stock markets must adapt to external shocks, such as climate change, by promoting renewable energy through technological innovation (Ma et al., 2021Naeem et al., 2021Özdurak, 2021Shao et al., 2021). Examining the issue from another perspective, investors are increasingly favoring companies with strong environmental, social, and governance scores, which significantly influence their investment decisions and reactions. According to a study by Jia et al. (2023), established a climate change attentiveness index outperforms macroeconomic predictors of energy stock returns. This is especially true during recessions and bear markets. In a similar setting, Ardia et al. (2023) used standards and poors (S&P 500) data to analyze how unforeseen fears about climate change impact stock prices for green companies. On high-worry days, the stock values of green firms rose, while those of brown firms declined, along with an increase in the discount rate for green businesses. Given the evolving landscape of market spillovers and the influence of climate change on investment decisions, the need to understand market dynamics in the face of these crises has become even more pressing.
Recent studies have emphasized the influence of renewable energy stocks and climate-friendly bonds on diversifying investment risks in the GCC. Apart from stock prices, market spillovers are the primary factors in shaping investors’ decisions. In a recent study by, and Kapar et al. (2024), the authors analyze the spillovers of the GCC economic sectors, showing that spillovers from the energy sector are the lowest, while those from the financial sector are the largest. In a previous study, Hung (2021) investigated the financial interconnectedness of GCC economies and reported the presence of a positive average return equi-correlation. However, the large heterogeneity in spillovers and time-varying periods makes portfolio diversification difficult. Upon examining the broader financial landscape, it becomes clear that economic policies and external factors, such as fluctuations in oil prices and uncertainty surrounding climate policy, significantly influence market behavior.
Understanding the interplay between these factors is crucial for policymakers and investors as they navigate the transition toward sustainable energy sources. The relationship between climate change, renewable energy, and GCC stock markets has been extensively studied using various methodologies., and Zhao et al. (2023) and Alkathery et al. (2023) examined spillover effects and wavelet analysis, finding that oil prices, emission prices, and global clean energy have a weak influence on GCC stock markets. Naeem et al. (2023) and Younis et al. (2024) highlight the role of clean energy stocks and climate-friendly bonds in diversifying investment risks. Similarly, Ansaram and Petitjean (2024) discovered a transition in investor focus from fossil energy to renewable energy. Other studies, such as those by Li et al. (2022), used quantile methods to demonstrate asymmetric relationships between fossil and renewable energy stocks. As theoretical frameworks on portfolio diversification highlight, investors are increasingly turning to renewable energy and technological innovations to reduce risks and enhance returns.
The interconnectedness of these markets, especially under extreme risk scenarios, further emphasizes the need for a deeper understanding of the dynamics at play. Additionally, economic and policy factors shape the GCC markets. Côté (2018) and AbouElseoud and Alkhaldi (2023) stressed the need for targeted policies to address labor market challenges and environmental consequences., and Zaier et al. (2024) and Khalfaoui et al. (2022) analyzed climate policy uncertainty and its effects on renewable energy stock returns., Lorente et al. (2023) revealed that strong short-term oil price impacts exist on GCC stocks, with renewable assets acting as safe havens during crises. These findings highlight the evolving financial landscape as GCC economies transition towards sustainability. While many investment choices are available to investors in response to climate change, there are also considerable hazards, as switching from dirty to clean technology requires substantial financial outlays. Consequently, optimizing portfolios entails understanding the magnitude and direction of shock spillovers from one market to another.
From a purely theoretical perspective, the theory posits that by diversifying their investments across non-correlated assets, investors can reduce risk without compromising returns (Yuan et al., 2024). behavioral portfolio theory, which considers the psychological aspects of risk reduction, recommends that investors diversify to accomplish a variety of objectives, including financial stability and positive returns. However, the benefits of diversification can disappear as markets become increasingly interconnected. Investors seeking higher profits and financial advantages are increasingly looking to renewable energy and technological innovations to address climate change concerns and financial uncertainties (Lorente et al., 2023). Additionally, the interconnectedness of the markets under study is examined during both typical and challenging market conditions, including those above extreme environmental risk events that affect the global renewable energy and GCC markets. Building on these theories, our study integrates wavelet quantile analyses to explore how climate change and renewable energy impact market interconnectedness and shock transmission. This analysis provides valuable insights into risk spillovers across GCC economies and renewable energy markets, particularly during periods of market stress. Table 1c summarizes the literature on the link between climate change, renewable energy, and GCC stock market dynamics

3. Data and methodology

3.1. Data and descriptive statistics

This study examined the dynamics of climate change and renewable energy in the GCC region. First, climate change is represented by regional temperature data from the GCC countries. Renewable energy is measured by the wilder hill clean energy index (ECOI), which comprises publicly listed companies that benefit significantly from the transition to cleaner energy and conservation. The regional temperature data of the GCC countries were used as a proxy to capture climate variability that directly affects energy demand, particularly in power-intensive sectors requiring cooling (Yuan et al., 2024). The ECOI is selected to represent renewable energy performance due to its broad coverage of publicly traded clean energy firms with global operations, including exposure to markets relevant to the GCC’s diversification strategies (Hossain et al., 2024Korkut et al., 2024). morgan stanley capital international (MSCI) country indices for GCC members are used to capture financial market performance in a standardized, comparable format across the region, ensuring consistency in measuring cross-country spillovers (Eleuch et al., 2025). Additionally, the GCC-MSCI index data were sourced from datastream, covering individual MSCI indices for the GCC markets from August 29, 2014, to December 2023. The choice of this time frame is driven by the fact that MSCI data for the largest economy in the region, Saudi Arabia, are available only from August 29, 2014, onwards. Hence, selecting this period ensured consistency and completeness across the GCC markets. Furthermore, the GCC-MSCI index is equally weighted and adjusted, making it a robust representation of stock market dynamics in GCC economies.
Table 1b presents the dataset, which consists of two panels. panel A focuses on the level indices, while panel B concentrates on returns for variables related to climate change, renewable energy, and MSCI prices of the GCC countries. From Table 1b, panel A (level indices), the mean temperature (TEMP) is 300.89 K, which indicates the average regional temperature in the GCC. The mean renewable energy index is 80.28, reflecting the average stock price of companies benefiting from the transition to cleaner energy. The mean MSCI prices for individual GCC countries vary, with Saudi Arabia having the highest at 1038.80 and Bahrain the lowest at 98.74. The standard deviation for temperature is 5.44, indicating relatively low variability in temperature, whereas the renewable energy index has a higher standard deviation of 48.30, suggesting more significant fluctuations in stock prices. Among the GCC countries, Saudi Arabia exhibits the highest standard deviation of 231.28, indicating considerable price volatility in its market, whereas Bahrain has a lower standard deviation of 23.34, suggesting greater stability. The maximum and minimum temperatures recorded were 308.83 and 289.32 K, respectively. The renewable energy index shows a maximum of 281.44, highlighting potential peaks in renewable energy stock performance, while the minimum is 36.53, indicating possible downturns in performance. The renewable energy index displayed a positive skewness of 1.71, suggesting a distribution with more extremely high values. The kurtosis of 5.45 indicates a distribution with heavy tails, implying that extreme outcomes are more likely.
From Table 1b, panel B (return), the mean return for renewable energy index is −0.002, indicating a slight average decline in stock performance. The mean returns for the GCC countries range from −0.007 (United Arabi Emirates) to 0.003 (Kuwait), suggesting mixed performance across the markets. The renewable energy index exhibited a standard deviation of 1.018, indicating high variability in returns. In contrast, Kuwait has a standard deviation of 0.530, indicating more stable returns than those of other GCC markets. The maximum return for renewable energy index is 10.041, while the minimum is −9.531, highlighting the extreme volatility in performance. For the GCC countries, returns range from a maximum of 4.719 (Oman) to a minimum of −9.820 (Kuwait). The skewness for the renewable energy index is −0.152, indicating a slight negative skew, whereas GCC countries, such as Bahrain, have a skewness of −1.968, suggesting more extreme negative returns. The kurtosis values, particularly for Oman (99.71), imply a distribution with extreme outliers that affect overall market stability. The augmented Dickey-Fuller (ADF) and Phillips-Perron (PP) test results indicate that all variables are stationary at first differences, as evidenced by significant test statistics, which is crucial for subsequent time series analyses.
Fig. 1 illustrates the time series of temperature (TEMP) in Kelvin, renewable energy as represented by the renewable energy index, and the level indices of GCC - MSCI prices. The graph captures the trends and fluctuations of these variables over time, highlighting their interrelationships. Fig. 2 presents the time series of temperature in red, renewable energy in green, and GCC - MSCI prices, providing a clear visual distinction between the variables. This representation facilitates a comparison of their dynamics and underscores the impact of temperature and renewable energy on GCC market performance.
Fig. 1
  1. Download: Download high-res image (729KB)
  2. Download: Download full-size image
Fig. 1
Fig. 2
  1. Download: Download high-res image (752KB)
  2. Download: Download full-size image
Fig. 2

3.2. Quantile vector autoregressive approach

The quantile vector autoregressive model, across extreme lower, higher, and median quantiles, enables us to capture connectivity metrics that reflect the behavior of economic relationships under both typical and extreme conditions (Diebold and Yilmaz, 2012Diebold and Yilmaz, 2014). The transmission of shocks within the economic framework, particularly through the lens of the quantile vector autoregressive model, is a crucial area of research for understanding interconnected financial markets, macroeconomic fluctuations, and the impact of monetary policy. Early studies by Sadorsky, 2009Henriques and Sadorsky, 2008were among the first to model the relationship between energy prices, clean energy stocks, and market volatility. The literature, including these early studies, has not adequately emphasized how quantile vector autoregressive can elucidate the mechanisms of shock transmission across diverse economic variables and markets. Similarly, the connectedness framework introduced by Diebold and Yilmaz, 2012Diebold and Yilmaz, 2014 laid the groundwork for quantifying spillover effects across financial variables. These seminal contributions provide the theoretical scaffolding upon which this study expands, using quantile and wavelet-based innovations. However, unlike traditional models that primarily focus on average interactions, this approach provides insights into how variables interact at the tails of the distribution. By integrating the quantile-linkage method, we specifically analyze the spillover effects between temperature, renewable energy, and market returns, providing a comprehensive view of their interconnectedness. This dual emphasis enhances our understanding of risk transmission and interdependencies, offering deeper insights that standard methodologies may overlook. Ultimately, our approach enables a more nuanced assessment of economic dynamics within the context of GCC economies. quantile vector autoregression models offer an advancement over the traditional vector autoregression by allowing researchers to account for the dynamics of economic relationships across different quantiles of the conditional distribution of the variables involved. There are several reasons why quantile vector autoregression and wavelet quantile correlation approaches are particularly suitable for modeling financial and climate-induced shocks in the GCC. Contrary to standard vector autoregression or time-varying parameter vector autoregression approaches, which assume symmetric responses around the mean, quantile vector autoregression models allow for tail-dependent and nonlinear spillovers, which are particularly important in cases of extreme events (e.g., oil crashes, pandemics, and climate shocks). In addition, although generalized autoregressive conditional heteroskedasticity and multivariate – generalized autoregressive conditional heteroskedasticity type models can capture volatility clustering, they are not appropriate for studying directional spillovers or network-based connectedness among quantiles. Although cointegration or fully modified ordinary least squares / autoregressive distributed lag model models are robust for long-run equilibrium analysis, they are static and cannot capture time-varying linkages. In contrast, wavelet quantile correlation offers a frequency-domain view, allowing us to decompose short, medium, and long-term dependencies - important in disentangling transient shocks from structural changes (in particular, we refer to the transition towards clean energy). The quantile vector autoregression and the wavelet quantile correlation, taken together, offer a powerful modeling environment that is particularly suited for time-frequency and asymmetric spillovers, which are precisely the features observed in GCC stock, temperature, and renewable energy markets.
We apply the quantile vector autoregression model at the extreme lower, higher, and median quantiles, adhering to the quantile regression methodology of (Markowitz, 1952). Consequently, we can now observe the connectivity metrics at the extreme tails of the distribution. Beyond concentrating on median quantile models with means, this technique offers other characteristics and applications. Hence, we employ the quantile-linkages method proposed by Ando et al. (2022) to examine quantile spillover linkages between temperature, renewable energy, and market returns in GCC economies from August 29, 2014, to December 2023. Although a considerable body of literature has explored shock transmission, the emphasis on quantile vector autoregression models and their capabilities remains underexplored. The lag order for the quantile vector autoregression model was determined using the akaike information criterion (AIC), and lag one was found to be optimal, striking a balance between model fit and complexity. Before estimation, the statistical properties of all variables were examined concerning stationarity using the Phillips Perron unit root tests. All series were found to be stationary at first differences. To mitigate the endogeneity problem, the model employed the generalized forecast error variance decomposition method, which is independent of the ordering of the variables. We further used rolling window estimation to (a) incorporate time-varying effects and (b) mitigate sensitivity to initial conditions.
To test the robustness of our findings, we performed various sensitivity analyses using both rolling windows (250-day) and thresholds (τ = 0.25 and 0.75). The key findings—especially that Saudi Arabia, the United Arab Emirates, and Kuwait led the way—were unchanged. We cross-validated the quantile vector autoregression -based spillovers with wavelet multiple correlation outputs, which provided further support for the temporal and directional reliability of the realized associations. Robustness results are provided in the appendix. By employing quantile vector autoregression frameworks, researchers can more effectively capture the complexities of shock interactions and their diverse impacts on various economic variables and markets. This understanding is pivotal for developing more effective economic policies and frameworks that mitigate the adverse effects of shocks, enhance financial stability, and promote a resilient economic environment in the country. Defining the infinite-order-based vector moving average parameters of the quantile vector autoregression, the quantile spillover measures are computed as follows:using the generalised forecast error variance decomposition constructed as follows, and a prediction horizon of H (Eleuch et al., 2025Diebold and Yilmaz, 2012).
 finds a zero-dimensional vector in which the ith position has the value 1. The following steps show how the elements are normalised according to the decomposition matrix:
The following explanations of the generalised forecast error variance decomposition -based spillover measurements are defined by (Hossain et al., 2024):
The term TO j, t represents the impact of variable j on variable i, indicating how j influences i. Conversely, FROM j,t reflects the effect of i on j, demonstrating an influence in the opposite direction. The net spillover, denoted as NET j,t, is the difference between TO and FROM, where negative values indicate that j is a net recipient of spillover, while positive values signify that it is a transmitter. Finally, TCIt represents the total connectedness index, summarizing the mean degree of overall linkages among the variables over time. This methodology offers several benefits for understanding the interconnected systems. First, it distinguishes between TO j,t and FROM j,t, providing insights into both the directional influences and the reverse effects. Second, the NET j,t calculation identifies the net transmitters and recipients of spillover effects, which is crucial for determining which variables drive changes. Third, the total connectedness index summarizes overall interconnectedness, enabling policymakers to assess resilience and vulnerability to shocks. Ultimately, the quantile analysis reveals the relationships across various conditions, enhancing risk management strategies related to climate change, renewable energy, and market dynamics. Furthermore, we consider the wavelet quantile approach for the analysis. This indicates the overall reliance caused by the combined time-frequency quantile ranges. It recognizes the dependency pattern over both quantiles and intervals of climate change. Renewable energy and GCC stock markets. Our analysis considered different frequencies and quantiles of the data.

3.3. Wavelet quantile correlation

Wavelet quantile correlation is a statistical approach that combines wavelet decomposition with quantile correlation to examine the dependence between two time series across both time and distributional dimensions. Unlike traditional correlation measures that capture only linear relationships around the mean, wavelet quantile correlation allows researchers to explore how variables relate at different quantiles, such as in the tails or the center of the distribution, while simultaneously distinguishing between short-, medium-, and long-term dynamics through wavelet analysis. This dual framework makes wavelet quantile correlation particularly well-suited for detecting nonlinear and asymmetric dependencies, especially under extreme conditions. wavelet quantile correlation is computed as followsWhere:
 are detail (wavelet) coefficient of series X and Y at scale j (short to long-term dynamics).
Qcovτ is the quantile covariance between X and Y
 gives quantile-specific dependence at time scale j

4. Results and discussion

Table 2 displays the wavelet quantile correlation statistics for various quantiles: median (τ = 0.50), extremely low (τ = 0.05), and extremely high (τ = 0.90) quantiles. These findings provide crucial insights into the interconnectedness of GCC economies, particularly in relation to energy transition, climate change, and economic interdependence. However, a study revealed that stock markets adapt to climate risks, thereby encouraging innovation in renewable energy (Naeem et al., 2023Shao et al., 2021).

Table 2. Returns statistics of quantile vector autoregression connectedness.

Quantile (median τ = 0. 50)
ECOITEMPSAUDI.ARABIAUAEQATAROMANKUWAITBAHRAINFROM
ECOI84.661.053.23.32.221.352.12.1115.34
TEMP0.9993.240.8311.240.930.860.96.76
SAUDI.ARABIA2.420.367.058.929.042.935.953.432.95
UAE2.770.648.4164.0411.043.485.713.9135.96
QATAR1.290.829.0111.6264.983.865.442.9935.02
OMAN0.840.693.294.194.3979.894.192.5320.11
KUWAIT1.080.615.875.935.353.7565.5311.8834.47
BAHRAIN1.240.573.624.433.332.4112.6771.7328.27
TO10.624.6834.2439.3936.6118.736.9227.71208.87
Inc. Own95.2997.92101.28103.43101.5998.59102.4599.44TCI
NET−4.71−2.081.283.431.59−1.412.45−0.5626.11
NPT01475263
Quantile (extreme lower τ = 0. 05)
ECOI21.0410.5211.7312.1511.1510.511.3111.5978.96
TEMP11.2922.3310.9311.1410.7610.8511.2211.577.67
SAUDI.ARABIA11.769.9719.4312.6611.9610.6812.0211.5480.57
UAE12.110.1612.6518.7212.510.711.6711.5181.28
QATAR11.579.7912.3413.2119.4510.9711.6611.0280.55
OMAN11.2910.3811.4611.7111.4319.8412.0511.8580.16
KUWAIT10.7910.0512.1411.9911.3611.0219.513.1680.5
BAHRAIN11.2210.1811.5911.6110.8911.0613.3720.0779.93
TO8071.0582.8284.4880.0475.7883.382.15639.63
Inc. Own101.0493.38102.25103.299.4995.61102.8102.22TCI
NET1.04−6.622.253.2−0.51−4.392.82.2279.95
NPT40572154
Quantile (extreme upper τ = 0. 90)
ECOI28.848.8211.0711.6110.39910.529.7571.16
TEMP10.0332.559.2410.079.319.2110.319.2967.45
SAUDI.ARABIA10.827.6625.9512.7912.129.1611.639.8774.05
UAE10.857.9812.0324.7313.149.7511.649.8775.27
QATAR10.317.6912.2613.9525.629.7611.019.474.38
OMAN9.98.4510.2111.3710.8428.2711.199.7871.73
KUWAIT10.128.2111.3312.0810.769.9224.612.9875.4
BAHRAIN9.938.4210.2711.39.869.3213.7127.1872.82
TO71.9757.2576.4183.1876.4266.1280.0170.92582.27
Inc. Own100.8189.79102.36107.91102.0494.39104.698.11TCI
NET0.81−10.212.367.912.04−5.614.6−1.8972.78
NPT30574162
Note: Results are based on a QVAR model with a 200-day rolling window size, lag length of order 1 (AIC), and a 10-step-ahead generalized forecast error variance decomposition.
For the median quantile, the NET results indicate that the Unite arab Emirates (3.43), Kuwait (2.45), and Qatar (1.59) are net influencers within the regional framework. These economies, as significant energy exporters, exert more influence than they receive, highlighting their pivotal role in shaping regional dynamics. In particular, the United Arab Emirates stands out because of its diversified economy and status as a financial hub. Conversely, renewable energy index (-4.71), representing the renewable energy index, and TEMP (-2.08), indicating temperature changes, are net receivers. Oman (-1.41) is also a net receiver, reflecting its smaller and more vulnerable economies. The total connectedness index at this quantile is 26.11, indicating moderate interconnectedness, where economic spillovers exist, but economies maintain some degree of independence. However, rising temperatures pose a threat to agribusiness and biodiversity (Lorente et al., 2023).
A study has observed that renewable energy is vital for achieving a 50 % reduction in emissions by 2050 (Raihan and Tuspekova, 2022). Under extremely adverse conditions, represented by the lower quantile (τ = 0.05), the NET results shifted significantly. Saudi Arabia (2.25), the UAE (3.2), and Kuwait (2.8) maintained positive NET values, confirming their resilience during crises. Their extensive oil reserves and financial capacity enable them to lead the region, even during downturns. Notably, the renewable energy index (1.04) became slightly positive, suggesting that renewable energy initiatives may play a minor stabilizing role during adverse conditions. However, Oman (-4.39) and TEMP (-6.62) showed large negative NET values, underscoring their vulnerability to external shocks. Furthermore, a study explored that climate change causes illnesses, drug resistance, and food shortages (Abbasi et al., 2022). Oman's dependence on regional growth and temperaturess high negative values likely indicate that temperature changes, possibly influenced by climate-related issues, are shaped more by broader environmental and economic factors than by regional influence.
The total connectedness index (79.95) is remarkably high, demonstrating how economic shocks in one GCC country spread rapidly across the region, making it highly susceptible to contagion during a crisis. Our results also illustrate that during periods of exceptional economic growth, as indicated by the highest quantile (τ = 0.90), the NET results exhibit a distinct pattern. The United Arab Emirates (7.91) and Kuwait (4.6) demonstrated significantly positive NET values, indicating their roles as primary catalysts of regional economic expansion. The United Arab Emirates's multifaceted economy, robust financial industry, and investment in non-petroleum sectors are the major drivers of this growth. Kuwait's substantial oil resources continue to exert influence. However, emerging economies require renewable energy, technology, and growth to address climate change challenges (Imaz and Sheinbaum, 2017).
Saudi Arabia (2.36) and Qatar (2.04) also made positive contributions, albeit to a lesser degree, suggesting that their energy exports and strategic investments contribute to the region’s prosperity. Conversely, Oman (-5.61) and temperature value (-10.21) are net beneficiaries. The negative impact of temperature suggests that thriving industrial activities, likely driven by economic growth, may contribute to environmental stress, underscoring the growing importance of climate considerations for the region's long-term sustainability. The total connectedness index (72.78) remained elevated, indicating that regional prosperity is likely to be distributed through robust trade and financial connections, particularly in the energy sector. Furthermore, innovation reduces greenhouse gas emissions and aids in achieving climate goals (Guo et al., 2017Imaz and Sheinbaum, 2017).
From an economic perspective, these findings emphasize the pivotal roles of Saudi Arabia, United Arab Emirates, and Kuwait in shaping regional dynamics during both crises and periods of prosperity. Their oil wealth, financial reserves, and increasingly diverse economies position them as stabilizers and growth engines in the GCC. Energy innovation benefits the environment in Finland (Alola and Onifade, 2022). In contrast, smaller economies, such as Oman and Bahrain, are more susceptible to external shocks, demonstrating their economic reliance on larger, neighboring countries. The consistently high total connectedness index values across all quantiles underscore the deeply intertwined nature of GCC economies. This interconnectedness results in the rapid transmission of both risks and benefits across the region, whether driven by fluctuations in oil prices, shifts in financial markets, or environmental challenges (Younis et al., 2024Barberà-Mariné et al., 2023). Consistently, renewable energy (solar power) reduces emissions, boosts security, and promotes sustainable growth (Lee and Ho, 2022).
The quantile vector autoregression analysis reveals that while major players, such as Saudi Arabia, the United Arab Emirates, and Kuwait, significantly influence regional outcomes across various economic conditions, smaller economies, including Oman and Bahrain, remain vulnerable to external factors, particularly fluctuations in oil prices. High total connectedness index values emphasize the interconnectedness of Gulf economies, where both risks and benefits are transmitted throughout the region, especially during extreme conditions. Similarly, climate change attentiveness outperforms traditional predictors of energy stock returns (Jia et al., 2023).
(extreme upper τ = 0. 90) and yellow color represents the quantile (median τ = 0. 50).
Fig. 3 displays the total connectedness index for three quantiles: the extreme lower (τ = 0.05), median (τ = 0.50), and extreme upper (τ = 0.90) quantiles, for the period 2015–2023. The visualization used color-coded bars: red for total connectedness index −0.05, yellow for total connectedness index −0.50, and green for total connectedness index −0.90. This visual representation enhances the quantile vector autoregression findings in Table 2, providing insights into how the interconnectedness of GCC economies fluctuates under various economic scenarios, including normal periods, downturns, and booms. However, Raihan and Tuspekova (Raihan and Tuspekova, 2022) emphasize the crucial role of renewable energy sources in helping economies achieve their target of a 50 % reduction in global emissions by 2050. The weak influence of oil prices, emission prices, and global clean energy on GCC markets (Younis et al., 2025Zhao et al., 2023Alkathery et al., 2023).
Fig. 3
  1. Download: Download high-res image (160KB)
  2. Download: Download full-size image
Fig. 3
The red bars indicate the total connectedness index during severe negative conditions (τ = 0.05), such as economic recessions or crises. Significant total connectedness index decreases are evident in 2016 and 2020, particularly after the 2016 oil price collapse and the 2020 coronavirus disease (COVID-19) outbreak. These reductions suggest a diminished interconnectedness during economic hardship, implying that GCC economies may prioritize domestic concerns during crises, which in turn leads to reduced interdependence with other regional economies. This aligns with the lower total connectedness index value of 79.95 in Table 2, indicating an increased vulnerability during negative shocks. However, the graph also demonstrates that connectedness can decline even further during extreme events. The median quantile (τ = 0.50), depicted by the yellow bars, showcases the total connectedness index under standard conditions. Clean energy stocks and climate-friendly bonds help diversify risks (Younis et al., 2024Naeem et al., 2023).
The total connectedness index generally remains consistent, ranging from 50 to 80 for most of the period, with noticeable drops in 2016 and 2020, as indicated by the red bars, which mirror the impact of economic disruptions on regular economic patterns. The median quantile total connectedness index value of 26.11 in Table 2 suggests moderate interconnectedness during normal times, demonstrating resilience against external pressures. Green bars, representing total connectedness index during periods of exceptional prosperity (τ = 0.90), dominate the upper section of the graph, consistently showing high total connectedness index values, often between 80 and 90 or above. This indicates strong interconnectedness among GCC economies during economic upswings, primarily driven by shared growth in the oil sector, a crucial component of GCC trade and income. The extreme upper quantile total connectedness index value of 72.78 in Table 2 confirms this robust regional interdependence during favorable economic circumstances, where oil production and trade benefits are distributed across regions. Quantile methods reveal asymmetric relationships between fossil and renewable energy stocks (Li et al., 2022).
From an economic perspective, Fig. 3 highlights the dual nature of regional interconnectedness in the GCC. During downturns, especially following the 2016 oil price drop and the COVID-19 pandemic, connectedness decreased significantly, particularly in the lower quantile. This reduction can be attributed to the GCC economies' oil dependence and the economic isolation that occurs during crises. However, policies must address the labor and environmental challenges in the GCC (AbouElseoud and Alkhaldi, 2023). Conversely, during growth periods, as indicated by the green bars, interconnectedness strengthens, with economic prosperity in one country (often driven by oil) rapidly spreading throughout the region, thereby bolstering trade, investment, and financial ties. The consistently high total connectedness index values during booms indicate that the region benefits from collective economic success, whereas the declines during crises highlight the fragility of this interconnectedness when confronted with external shocks. The graph aligns with the data in Table 2, confirming that GCC economies are highly interdependent during periods of prosperity but exhibit reduced interconnectedness during times of economic stress.
The NET spillover analysis across the extreme lower quantile (τ = 0.05), median quantile (τ = 0.50), and extreme upper quantile (τ = 0.90) offers valuable insights into the interplay of influence among the GCC economies and renewable energy and climate change variables (Fig. 4). This comprehensive examination sheds light on the interactions between these countries and factors during economic crises, stable periods and boom times. During economic downturns, represented by the extreme lower quantile (τ = 0.05), larger oil-exporting economies, such as Saudi Arabia, the United Arab Emirates, and Kuwait, exhibit a moderate net influence, whereas smaller economies, including Oman and Bahrain, are net recipients. The renewable energy index fluctuates between influence and vulnerability, indicating that global oil markets and other external shocks often impact the local economy during crises (Abban et al., 2022). Diversification reduces risk, but growing market interconnectedness limits its benefits (Markowitz, 1952Ando et al., 2022Al-Maadid et al., 2025).
Fig. 4
  1. Download: Download high-res image (819KB)
  2. Download: Download full-size image
Fig. 4
  1. Download: Download high-res image (425KB)
  2. Download: Download full-size image
Fig. 4
Temperature (TEMP) consistently remained a net receiver, implying that environmental and industrial activities are more affected by economic downturns than by driving changes. Under normal conditions, as depicted by the median quantile (τ = 0.50), the influence is more evenly distributed. Saudi Arabia, the United Arab Emirates, and Kuwait maintained positive NET spillovers, underscoring their role in regional economic stability. Qatar occasionally joins them as a net influencer on the world stage. renewable energy index demonstrates stronger positive spillovers post-2021, suggesting that domestic economic performance plays a more significant role in shaping regional interconnections during stable periods. However, Oman and Bahrain continue to be largely net receivers, reflecting their dependence on external factors, such as regional trade and energy prices. In periods of economic prosperity, as represented by the extreme upper quantile (τ = 0.90), Saudi Arabia, the United Arab Emirates, and Kuwait solidify their positions as key drivers of regional growth, exhibiting significant positive spillovers. Oil prices have a significant impact on GCC stocks, and renewable assets serve as safe havens during crises (Lorente et al., 2023Younis et al., 2025).
Th renewable energy index exhibits consistent positive spillovers, underscoring the significance of internal economic strength during periods of growth. Oman and Bahrain continue to receive more than they contribute, benefiting from regional growth while making only modest contributions to it. Temperature remained a net receiver, indicating that the environmental impacts of economic expansion did not shape regional dynamics.
The results in Fig. 4 also underscore the crucial roles of Saudi Arabia, the United Arab Emirates, and Kuwait in driving both recovery and growth in the GCC, while smaller economies like Oman and Bahrain are more dependent on external conditions. The prevalence of oil and regional trade ensures high interdependence during growth periods and vulnerability during downturns, emphasizing the need for diversification and resilience strategies across the region. Consistent with a study, oil prices have a significant impact on stocks, and renewable assets serve as safe havens during crises (Lorente et al., 2023). Fig. 5 illustrates the interconnectedness between temperature and GCC economies across three quantiles: extreme lower (τ = 0.05), median (τ = 0.50), and extreme upper (τ = 0.90) quantiles. The results consistently show that temperature is a net receiver of influence, with varying intensities across different economic conditions. This pattern reflects the GCC economies' heavy reliance on energy-intensive industries and fossil fuel production, which impacts temperature-related variables rather than being affected by them. During economic downturns (τ = 0.05), temperature is heavily influenced by the broader economic landscape of the region. Bahrain, Kuwait, and Oman exhibit significant negative spillovers, suggesting that reduced industrial activity and energy demand during crises lead to lower emissions, which subsequently affect temperature. However, energy innovation benefits the environment, and renewable energy is crucial for achieving a 50 % reduction in emissions by 2050 (Alola and Onifade, 2022Raihan and Tuspekova, 2022).
Fig. 5
  1. Download: Download high-res image (1MB)
  2. Download: Download full-size image
Fig. 5
However, Saudi Arabia and the United Arab Emirates occasionally exhibit a slight influence of temperature, possibly due to localized climate conditions affecting energy demand in temperature-sensitive industries, such as agriculture and energy production. Under typical economic conditions (τ = 0.50), temperature remains a net receiver, although the spillovers are less pronounced than downturns. Kuwait and Saudi Arabia experience brief periods in which temperature has a small positive influence on economic variables, indicating that during stable conditions, temperature fluctuations (likely driven by climate or seasonal changes) may begin to impact sectors such as energy consumption. Nevertheless, Bahrain, Oman, and Qatar continue to be primarily net influencers, reinforcing the notion that economic activities drive environmental factors, rather than the reverse. During economic booms (τ = 0.90), the relationship between temperature and GCC economies is predominantly one-sided. Thriving economies, particularly those of Kuwait, Qatar, and Saudi Arabia, demonstrated stronger negative spillovers, reflecting the substantial impact of industrial growth and energy production on global temperatures. As economic activity intensifies, energy consumption increases, leading to higher emissions and greater environmental strain, which further highlights the role of temperature as a key indicator. However, the United Arab Emirates and Saudi Arabia exhibited some fluctuations during this period, suggesting that in times of extreme growth, temperature may occasionally influence energy demand and related economic sectors, although its overall impact remains limited. temperature consistently acted as a net receiver across all quantiles, emphasizing the significant environmental influence exerted by energy-dependent GCC economies. These findings underscore the need for climate-resilient policies, as economic fluctuations substantially impact environmental factors, particularly temperature. Similar to another study, they found that renewable energy (solar power) cuts emissions, boosts security, and promotes sustainable growth (Lee and Ho, 2022).
Fig. 6 depicts the NET pairwise connectedness between renewable energy and GCC economies at extreme lower (τ = 0.05), median (τ = 0.50), and extreme upper (τ = 0.90) quantiles. showed the interaction between renewable energy and economic conditions under various circumstances, from economic downturns to periods of growth. During economic hardships, such as oil price slumps or global financial crises, renewable energy primarily serves as a net recipient of influence from the broader GCC economies. Economies such as Oman, Qatar, and Bahrain experience predominantly negative spillovers, suggesting that renewable energy investments suffer during economic contractions, as these countries prioritize stabilizing traditional sectors, including oil and gas. Furthermore, studies have shown that emerging economies can address climate challenges through the adoption of renewable energy, technology, and growth (Imaz and Sheinbaum, 2017Koop et al., 1996). These smaller economies' heavy reliance on oil revenues means that any downturn in the oil market limits their ability to invest in renewable energy projects, making the sector highly susceptible to broader economic conditions. Conversely, larger economies, such as Saudi Arabia and the United Arab Emirates, occasionally exhibit positive spillovers, indicating that their long-term commitment to diversifying energy sources remains intact even during challenging periods. Both countries have implemented national strategies aimed at economic diversification, including the development of renewable energy, as evidenced by initiatives such as Saudi Arabia's Vision 2030 and the United Arab Emirates's Energy Strategy 2050.
Fig. 6
  1. Download: Download high-res image (1MB)
  2. Download: Download full-size image
Fig. 6
The substantial and evolving effects of renewable energy and fintech on European real estate markets during the crisis were investigated by (Shah et al., 2025). Under normal economic conditions, represented by the median quantile (τ = 0.50), the relationship between renewable energy and GCC economies becomes more balanced. Kuwait, Saudi Arabia, and the United Arab Emirates exhibit positive spillovers, suggesting that renewable energy is beginning to shape these economies and influence energy policy, investments, and infrastructure development. This indicates that renewable energy projects, although still under development, are gaining momentum, particularly in economies with broader diversification goals. Meanwhile, Oman and Bahrain continue to act as net receivers, but the negative spillovers are less pronounced than those associated with economic downturns. This implies that while renewable energy remains secondary to fossil fuels, it is gradually being incorporated into the energy strategies of these countries. Consistently, oil prices have a significant impact on stocks, and renewable assets often act as safe havens during crises (Lorente et al., 2023).
During periods of economic growth, as indicated by the highest quantile (τ = 0.90), renewable energy has a greater influence on the overall economic landscape, particularly in Saudi Arabia, Kuwait, and the UAE, which demonstrate robust positive spillover effects. Major renewable energy projects, such as Saudi Arabia's solar ventures and the United Arab Emirates's Masdar City, have significantly contributed to economic growth during periods of prosperity. Nevertheless, smaller economies such as Qatar, Bahrain, and Oman continue to exhibit negative spillovers, suggesting that, even in times of prosperity, renewable energy is more influenced by traditional sectors and economic trends than it influences them. Consistently, policies must address labor and environmental challenges in the GCC (AbouElseoud and Alkhaldi, 2023). From an economic perspective, this study highlights the increasing importance of renewable energy in larger economies, such as Saudi Arabia, Kuwait, and the UAE, which are leading the shift toward a more sustainable energy mix. During periods of economic prosperity, these economies view renewable energy as a crucial contributor to economic success, supported by long-term strategic planning and global environmental commitments. This dynamic reflects the broader trend in the GCC region, where the energy transition is gaining traction, but conventional energy sources continue to dominate, especially during economic downturns or in smaller and less diversified economies. Contrasting investors shift from fossil fuels to renewable energy (Ansaram and Petitjean, 2024).
Fig. 7 shows the robustness of the results with different windows rolling and future 10-step-ahead (150 WR and 30 10-step-ahead), illustrating the interconnectedness among temperature, renewable energy, and the GCC economies, showcasing their interactions in three economic scenarios: the extreme upper quantile (τ = 0.90), median quantile (τ = 0.50), and extreme lower quantile (τ = 0.05).
Fig. 7
  1. Download: Download high-res image (247KB)
  2. Download: Download full-size image
Fig. 7

4.1. Countries’ MSCI prices at the returns

Blue nodes represent net shock transmitters, and net shock receivers are depicted in yellow. The thickness of the connecting lines indicates the strength of pairwise directional connectedness, and the size of each node reflects its overall network impact, signifying the level of influence or dependence each economy or sector has on others. However, the GCC energy sector has low spillovers, whereas finance has the highest (Kapar et al., 2024). During periods of economic prosperity, represented by the extreme upper quantile (τ = 0.90), Saudi Arabia, the United Arab Emirates, and Kuwait act as primary shock transmitters. These major economies, with their substantial oil resources and diverse investments, have a significant influence on regional dynamics, particularly during periods of high economic activity. Conversely, Oman, Qatar, Bahrain, and temperature are shock receivers, demonstrating their dependence on the economic actions of more dominant regional players such as Saudi Arabia. During these boom times, renewable energy index remains more responsive to the broader economic climate, suggesting that conventional energy sectors continue to lead in driving growth. Under typical economic conditions, as depicted by the median quantile (τ = 0.50), the network structure becomes more evenly distributed. Saudi Arabia, the United Arab Emirates, and temperature emerge as shock transmitters, reflecting their increasing influence on regional economic activities. temperature's role as a transmitter indicates that environmental factors, such as climate risks, are becoming increasingly important in shaping economic policy and energy consumption patterns. Meanwhile, renewable energy index, along with Qatar, Oman, Bahrain, and Kuwait, remains a shock receiver, suggesting that these economies and the renewable energy sector are more affected by external conditions than they are drivers of regional economic shifts. In times of economic hardship, as indicated by the extreme lower quantile (τ = 0.05), Saudi Arabia, the United Arab Emirates, and temperature continue to play a primary role as shock transmitters, significantly impacting the wider region, consistent with (Kapar et al., 2024).
The renewable energy index and smaller economies, such as Oman, Qatar, and Bahrain, remain shock receivers, demonstrating their reliance on larger, oil-dependent economies and the emphasis on conventional energy sectors over renewable sources during challenging times. From an economic perspective, this network configuration underscores the significant influence of Saudi Arabia, the United Arab Emirates, and Kuwait in shaping the regional economy, primarily through their substantial oil production and diverse economic portfolios. These economies consistently send shocks throughout the region, underscoring their impact during both prosperous and challenging periods. Oman, Qatar, and Bahrain exhibit greater vulnerability and dependence on the economic activities of their larger neighbors, particularly during downturns. While growing in significance, the renewable energy sector remains largely influenced by broader economic conditions, with the renewable energy index often serving as a shock absorber. Similarly, investors turn to renewable energy and innovation for financial stability and risk management (Lorente et al., 2023).

4.2. Robustness test using the wavelet quantile correlation

Fig. 8 depicts the wavelet quantile correlation between temperature, renewable energy index, and market returns in the GCC countries across short-, medium-, and long-term periods. temperature’s correlation with market returns is most evident in the medium and long term for most GCC economies. Short-term correlations are generally weaker, suggesting that daily temperature fluctuations have a minimal immediate impact on market behavior. In the medium term, temperature begins to exert a stronger influence, reflecting how gradual climate shifts can affect energy demand, such as by increasing cooling requirements during warmer periods, which may impact energy consumption and market prices. Long-term correlations are the strongest, indicating that persistent temperature patterns (e.g., seasonal variations or extended heat waves) significantly affect the region's economic performance, especially in markets heavily reliant on energy, such as Saudi Arabia and Kuwait. Similarly, climate concerns raise green stock prices, while brown stocks decline (Ardia et al., 2023).
Fig. 8
  1. Download: Download high-res image (366KB)
  2. Download: Download full-size image
Fig. 8
  1. Download: Download high-res image (368KB)
  2. Download: Download full-size image
Fig. 8
For renewable energy index, correlations tend to strengthen over medium- and long-term periods in major markets such as the United Arab Emirates and Saudi Arabia. The short-term effects of renewable energy on market returns are relatively minimal, indicating that renewable energy investments and initiatives often require extended periods to have a noticeable impact on market performance. As renewable energy projects and policies gain traction in the medium term, their impact on economic performance becomes increasingly noticeable. The long-term integration of renewable energy into the broader economy is most apparent in countries actively diversifying away from oil. Conversely, Qatar and Oman exhibit weaker long-term impacts, suggesting that renewable energy is less integrated into their economic frameworks than their dependence on conventional energy sources.
This temporal analysis highlights that climate change has a more significant impact on GCC markets in the medium to long term, while the influence of renewable energy increases over extended periods, particularly in more diversified economies such as the United Arab Emirates and Saudi Arabia.

5. Conclusion and policy implications

This study employed quantile vector autoregression and wavelet quantile correlation techniques to examine the complex relationships among temperature, renewable energy, and market returns in GCC economies from August 29, 2014, to December 2023. The analysis offers a crucial understanding of how these variables interact across various quantiles, encompassing extreme, median, and normal economic conditions over short-, medium-, and long-term periods.
The study reveals that temperature-related factors generally act as shock receivers in most GCC countries, especially in the short term, underscoring the reactive nature of temperature and its reliance on broader economic and industrial activities. However, over extended periods, temperature shows stronger correlations, particularly in energy-intensive economies such as Saudi Arabia and Kuwait, suggesting that climate-related events, such as prolonged heatwaves or seasonal shifts, can substantially impact energy demand and market performance.
Regarding renewable energy, the research uncovered varying degrees of integration across the GCC region. Saudi Arabia and the United Arab Emirates, the region's largest and most diverse economies, display stronger long-term correlations with market returns, indicating the growing influence of renewable energy on economic outcomes. These countries are actively investing in renewable energy as part of their economic diversification plans, including Saudi arabia’s vision 2030 and the United Arab Emirates's energy strategy 2050. The findings suggest that the role of renewable energy in these economies is becoming increasingly significant, particularly in the medium and long term, as projects come to fruition and begin to shape market dynamics. In contrast, smaller economies, such as Oman, Qatar, and Bahrain, exhibit weaker correlations, particularly in the short and medium terms, reflecting their continued dependence on conventional energy sources and slower adoption of renewable energy.
From a policy perspective, as the most dominant economy in the GCC, Saudi Arabia’s spillover effects remain significant across all quantiles, indicating its systemic importance during both normal and extreme market conditions. Accelerate renewable energy development by enforcing legally binding clean energy targets and reducing reliance on fossil fuels. Saudi Arabia should introduce countercyclical fiscal buffers to mitigate high quantile spillovers during crises and ensure macroeconomic stability. Expanding green projects and establishing a GCC-wide climate mitigation fund to aid smaller economies, such as Oman and Bahrain, during extreme downturns is recommended. The United Arab Emirates remains a net transmitter of shocks across the entire quantile spectrum, reflecting its economic dominance. However, the country’s exposure to global markets amplifies its vulnerability to crises. The United Arab Emirates should focus on carbon pricing and emissions trading systems to ensure sustainable economic growth. Furthermore, it focuses on climate issues and green sustainability for banks, tourism, and industries, safeguarding against systemic risks in extreme quantiles. Expanding sustainable finance frameworks and increasing green bond issuances to attract environmental, social, and governance - focused investors is recommended. Kuwait’s quantile analysis reveals that upper quantile financial spillovers are significant, meaning that they play a dominant role in transmitting financial shocks during extreme market booms. However, its lower quantile spillovers indicate vulnerability to downturns. Kuwait must diversify its sovereign wealth fund investments into technology and clean energy industries to reduce economic cyclicality. Enhance fiscal policy coordination to absorb negative spillovers during crisis periods, particularly in lower quantiles of the economy. Qatar’s economic influence in the GCC remains stable across the mid-quantiles but exhibits significant spillovers in the extreme upper quantiles, indicating that it benefits from energy booms but is vulnerable to the risks of downturns. Qatar must commit to a 50 % renewable energy mix by 2040, in alignment with global sustainability targets. Smart agriculture policies should be introduced to mitigate the impact of climate volatility on food and energy markets. Develop a regional clean energy hub by integrating hydrogen energy projects to support economic diversification and sustainable development. Oman is a net receiver of shocks, especially in the lower quantiles, making it the most vulnerable GCC economies during a crisis. Oman should focus on introducing aggressive foreign direct investment incentives for renewable energy and position itself as a hub for clean energy manufacturing. Countercyclical fiscal policies should be developed, including emergency tax relief and financial buffers, to mitigate the impact of economic fluctuations. Implement a national climate resilience strategy by integrating disaster risk management into financial planning and decision-making processes. Bahrain’s quantile results highlight high vulnerability in lower quantiles, suggesting that it absorbs more shocks during financial crises than it does during financial crises. Bahrain must expand its digital financial infrastructure and enhance the efficiency of its capital market. Blockchain-based financial instruments are introduced to improve economic stability. Sustainable fintech policies should be developed to encourage green lending and investment in climate adaptation solutions.
The wavelet quantile correlation analysis shows that temperature and renewable energy interact differently with market returns across various time horizons, especially during economic extremes (upper and lower quantiles). During economic downturns, the influence of renewable energy diminishes as traditional energy sectors take precedence. However, during times of economic prosperity, renewable energy gains traction, particularly in Saudi Arabia and the UAE, indicating that economic growth facilitates increased investment in renewable energy projects, which in turn positively affects market returns.
The findings of this study have important implications for investors, industries, and policymakers in the GCC region. The increasing significance of renewable energy investment offers promising opportunities. Investors should prioritize portfolios that focus on renewable projects, particularly in larger economies such as Saudi Arabia and the United Arab Emirates, which are actively diversifying their energy sources. Long-term investments in these sectors can yield substantial returns as demand for renewable energy continues to increase. Conversely, investors should exercise caution in smaller GCC economies, such as Oman and Bahrain, where the transition to renewables is slower and reliance on traditional energy sources remains high. Industries, especially those in energy-intensive sectors, should adapt to the changing landscape by investing in energy-efficient technology and renewable energy sources. This study highlights that climate-related factors have a significant impact on energy demand; therefore, industries must develop strategies to mitigate the risks associated with temperature fluctuations.
The GCC economies stand at a critical juncture where economic growth must align with urgent climate adaptation needs. Our quantile-based findings highlight that during extreme conditions, risk spillover intensifies, amplifying economic vulnerability. Policymakers must act decisively by implementing targeted strategies to enhance resilience, reduce reliance on fossil fuels, and strengthen regional economic coordination. The success of these measures will determine the GCC’s ability to navigate future crises while ensuring its sustainable growth. The results of this study have significant policy implications for GCC decision-makers, particularly given that countries in the region aim to reduce their reliance on oil and incorporate more sustainable energy options into their economic frameworks. This study highlights the growing importance of renewable energy and climate-related factors in shaping the future economic trajectory of the GCC. Policymakers must seize the opportunities presented by renewable energy while preparing their economies to adapt to the long-term risks posed by temperature variability and dependence on traditional energy sectors. By championing a forward-looking policy agenda, the GCC countries can secure sustainable growth and enhance their global competitiveness during the energy transition. Future studies could explore the long-term impact of climate change policies on market stability and the role of technological advancements in enhancing resilience across the GCC.

CRediT authorship contribution statement

Mohamed Sami Ben Ali: Validation, Supervision, Resources, Project administration, Methodology, Investigation, Funding acquisition. Ijaz Younis: Writing – original draft, Software, Formal analysis, Data curation. Alanoud Al-Maadid: Validation, Supervision, Resources, Project administration, Methodology, Funding acquisition.

Funding

"Research reported in this publication was supported by the Qatar Research Development and Innovation Council under grant #ARG01–0508–230093. The content is solely the responsibility of the authors and does not necessarily represent the official views of Qatar Research Development and Innovation Council.”

Declaration of Competing Interest

The authors declare that they have no known competing financial interests or personal relationships that could have appeared to influence the work reported in this paper.

Appendix

Table 1a. Variables of the study

Variables (Abbreviation)DescriptionSource
Climate changeRegional temperature of GCC countries(Henriques and Sadorsky, 2008)
Renewable energy (ECOI)The publicly listed companies that make up the WilderHill Clean Energy Index are those whose businesses stand to gain significantly from society's shift toward cleaner energy and conservation. The index is equally weighted and modified.Data Stream
GCC-MSCIAll data on the individual market MSCI indices are collected from Thomson Reuters DataStream.Data Stream

Table 1b. Descriptive statistics and tests

Panel A: Temperature (TEMP) (unit = kelvin), renewable energy (ECOI), and GCC countries’ MSCI prices at level indices
TestsECOITEMPBAHRAINKUWAITOMANQATARSAUDI ARABIAUAE
Mean80.28300.8998.74611.19618.50828.981038.80386.65
Median59.39301.6193.13577.40610.71808.86994.06387.45
Maximum281.44308.83148.31941.87895.891207.161671.21592.34
Minimum36.53289.3267.85361.65394.83617.03612.03209.90
Std. Dev.48.305.4423.34149.57116.97104.60231.2859.48
Skewness1.71−0.240.560.350.201.030.490.32
Kurtosis5.451.631.991.991.884.102.414.06
Jarque-Bera1796.83214.84232.17154.04141.65550.78134.49153.66
Probability0.000.000.000.000.000.000.000.00
Observations2433.002433.002433.002433.002433.002433.002433.002433.00
ADF (Level)−1.33−5.78***−1.35−1.24−2.10−3.18***−1.65−1.54
ADF (First diff)−32.23***−31.34***−18.68***−21.40***−25.01***−48.55***−26.04***−25.01***
DF-GLS (Level)−1.32−1.55−0.80−1.16−0.55−0.19−1.12−0.92
DF-GLS (First diff)−24.38***−4.10***−2.48***−21.17***−2.11***−6.45−7.13***−10.37***
PP (Level)−1.39−2.56−1.22−1.25−1.92−3.25***−1.65−1.74
PP (Fist Diff)−48.50***−41.72***−51.31***−21.28***−48.08***−48.60***−26.47***−26.15***
Panel B: Temperature (TEMP) (Unit = kelvin), Renewable energy (ECOI), and GCC countries MSCI prices at returns
Mean−0.002−0.0010.0010.003−0.003−0.0070.003−0.007
Variance1.0360.0070.2810.2080.1490.2420.2790.307
Median0.008−0.0020.0000.0000.0000.0000.0000.000
Maximum10.0410.4683.4443.7214.7193.8333.7404.578
Minimum−9.531−0.521−7.632−9.820−5.458−6.033−7.433−6.687
Std. Dev.1.0180.0840.5300.4560.3860.4920.5280.554
Skewness−0.152−0.122−1.968−4.518−1.033−0.849−1.773−1.050
Kurtosis13.417.3936.4299.7138.0817.9130.1224.01
Jarque-Bera10992.551954.16114696.59955622.23125103.9622795.8675763.0045148.98
Probability0.000.000.000.000.000.000.000.00
ADF (Level)−33.11***−31.32***−18.88***−19.21***−25.15***−48.35***−19.43***−48.01***
ADF (First diff)−23.86***−20.72***−22.68***−21.85***−19.64***−19.39***−24.36***−23.25***
DF-GLS (Level)−6.96***−4.15***−3.38***−14.75***−2.84***−13.97***−6.66***−24.15***
DF-GLS (First diff)−0.60−1.65−3.74***−21.98***−25.22***−1.71*−0.70−0.44
PP (Level)−50.57***−42.00***−51.60***−47.19***−46.92***−48.35***−50.01***−48.01***
PP (Fist Diff)−90.68−70.26***−90.90***−84.77***−86.48***−85.57***−90.20***−86.02***
Q1(10)21.80***117.31***40.32***52.10***32.88***11.33**34.39***15.86***
Q2(10)448.23***53.01***387.58***120.11***35.04***57.52***130.44***797.26***

Table 1c. Climate Change, Renewable Energy, and GCC Stock Markets Dynamics

Authors & YearMethodsVariables of the StudyFindings
Zhao, Lau, Soliman and Farhani (Zhao et al., 2023)Spillover index (Diebold & Yilmaz, 2012)Oil prices, Emission prices, Stock marketsDependence structure among oil, emissions, and GCC stock markets
Alkathery, Chaudhuri and Nasir (Alkathery et al., 2023)Wavelet analysisGlobal clean energy, CO2 prices, GCC energy stock marketsWeak positive correlation between GCC energy stock prices and clean energy
Naeem, Sadorsky and Karim (Naeem et al., 2023)Cross-Quantilogram techniqueClean energy stocks, green bonds, GCC stock marketsGreen bonds provide diversification benefits in GCC stock markets
Younis, Shah, Missaoui and Tang (Younis et al., 2024)TVP-VAR model, Diebold-Yilmaz frameworkClimate change, Renewable energy, G17 banking stocksSignificant risk spillover and connectedness among markets
Ansaram and Petitjean (Ansaram and Petitjean, 2024)VAR modelFossil energy, Renewable energy, Stock marketsShift from fossil to renewable energy affecting stock and carbon markets
Côté (Côté, 2018)Qualitative analysisRenewable energy, GCC labor marketsPotential for job creation in GCC but requires policy adaptation
Zaier, Mokni and Ajmi (Zaier et al., 2024)Mixed-Frequency Causality Test (MFCT)Climate policy uncertainty, Renewable energy stocks, Oil pricesOil prices influence renewable energy stocks in short-term
Younis, Naeem, Shah and Tang (Markowitz, 1952)TVP-VARGCC, BTC, Oil, Stock MarketsLess interconnected during oil battles and Russia-Ukraine conflict, more interconnected during COVID−19 crisis; Oman, Kuwait, gold, and Qatar are major spillover receivers.
Li, Xu and Meng (Li et al., 2022)Quantile-Quantile Regression (QQ), Quantile Causality (QC)Fossil energy, Renewable energy stocksAsymmetric relationship, stronger impact in bearish market
Kasem and Alawin (Ando et al., 2022)Pooled OLS RegressionRenewable energy consumption, GDP per capita, CO2 emissionsRenewable energy reduces CO2 emissions in GCC
AbouElseoud and Alkhaldi (AbouElseoud and Alkhaldi, 2023)Panel ARDL ModelGDP growth, CO2 emissions, Climate variablesGCC economic growth linked to environmental impact
Khalfaoui, Mefteh-Wali, Viviani, Jabeur, Abedin and Lucey (Khalfaoui et al., 2022)Spillover and Connectedness Network AnalysisClimate risk, clean energy, US stock marketsClimate risk affects US stocks under market stress
Shah, Younis, MISSAOUI and Liu (Shah et al., 2025)Connectedness ApproachRenewable Energy, Fintech, European Real EstateChanging role of risk spillovers of renewable energy and fintech with European real estate markets during COVID−19 and Russia-Ukraine conflicts.

Data availability

Data will be made available on request.

Keywords:
Climate change